

Sunday, July 26th 2026
App Store Connect Analytics: what Shopify brands can (and can't) measure
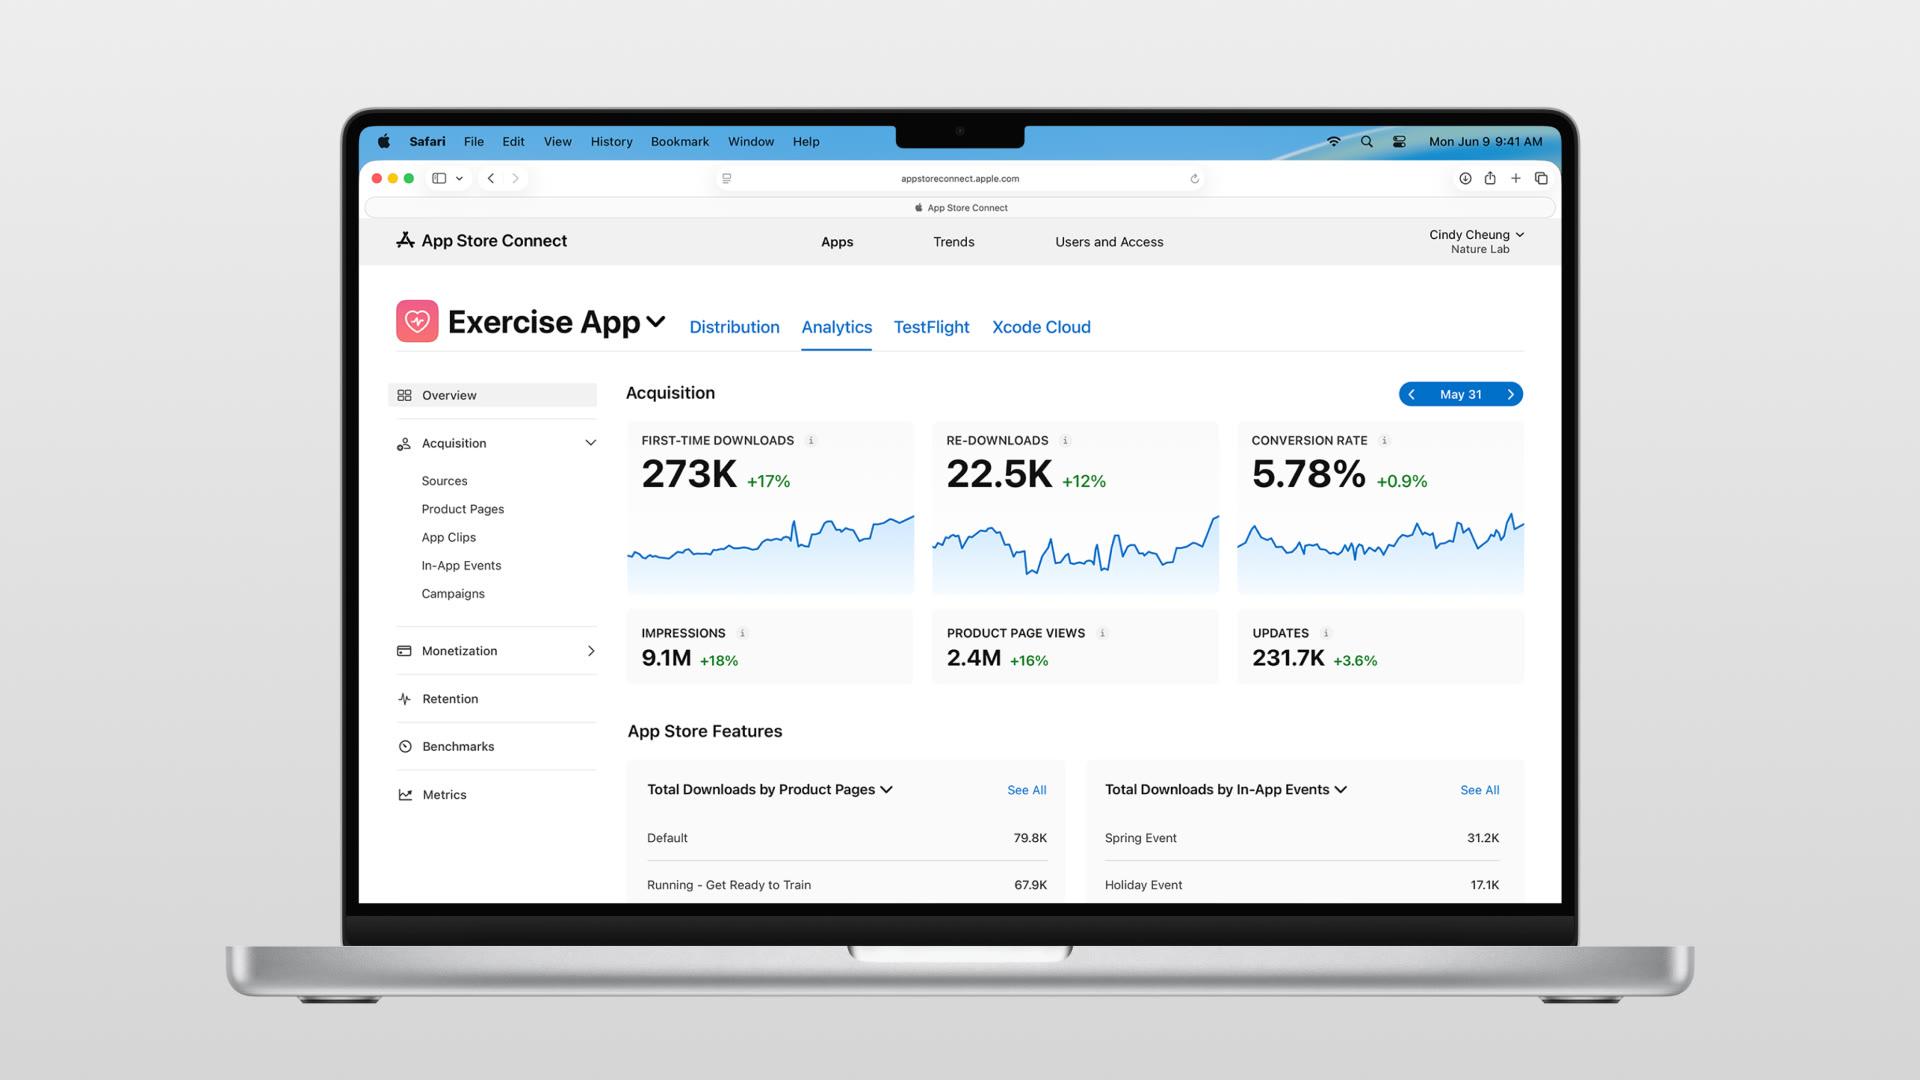

App Store Connect Analytics is Apple's built-in reporting for every App Store app. For a Shopify brand, it shows how people find your app, how many download it, how often they return, and how you compare with similar apps. It does not measure revenue from Shopify orders of physical products, because its monetization reports cover in-app purchases only.
This guide covers what is in it, what changed in Apple's 2026 update, and the part that does not apply to a physical-goods brand.
App Store Connect Analytics is useful for discovery, downloads, conversion, sessions, and retention. Its monetization reports are for apps that sell digital goods through Apple's in-app purchase system, not stores that check out physical products through Shopify. Knowing the difference stops you from chasing numbers that will not appear.
For the Android equivalent, see Google Play Console Analytics for Shopify brands. For the combined commerce, retention, and app-store scorecard, use the mobile app metrics guide.
What App Store Connect Analytics is
App Store Connect Analytics is the analytics dashboard inside App Store Connect, Apple's console for managing apps. It reports on how your app performs on the App Store and on device, across iOS, iPadOS, macOS, tvOS, and visionOS. It's included with App Store Connect at no additional analytics fee (Apple Developer Program membership itself is paid), and it covers acquisition (downloads and their sources), engagement (active devices, sessions, retention), and monetization (proceeds, paying users, and sales for apps that use Apple's commerce system).
One detail shapes everything below: most of the usage data only includes people who agreed to share their diagnostics and usage information with developers, and Apple defines each metric precisely (Apple's metric definitions). So the numbers are directional and device-based, not a complete census of your users. More on that in the privacy section.
It is not your commerce analytics. It will not show your app's average order value, how app buyers' lifetime value compares with web buyers', or the app's share of online revenue. For a Shopify brand, that data lives in Shopify and the app platform.
What's new in the 2026 App Store Connect Analytics update
As of July 2026, Apple's most recent refresh added more than 100 new metrics and reshaped the reporting around monetization and cohorts (Apple's update announcement). Platform dashboards change quickly, so date-check against Apple's documentation before you rely on any single feature. The headline changes:
- Monetization and subscription data. Access to In-App Purchase and offer performance directly in Analytics, so apps that sell through Apple's system can see proceeds, sales, and subscription behavior in one place.
- Cohort analysis. Create cohorts by download date or subscription-start date, then segment them by source, territory, device, and more, and track how each group behaves over time (Apple's cohort documentation). Expanding into a new region? You can watch how long a download cohort there takes to return versus your established markets.
- Two new monetization benchmarks. Peer group benchmarks now include download-to-paid conversion and proceeds per download, so you can see how your monetization stacks up against similar apps.
- Two new subscription reports. Exportable through the Analytics Reports API for offline analysis and integration into your own data stack.
- More filters at once. Apply up to seven filters to a metric to drill into a specific slice (a territory, a source, a version) without exporting anything.
The cohort and benchmark additions are useful for a commerce brand. Subscription and In-App Purchase reporting mostly measures a business model you do not run.
User acquisition: how people find and download your app
The acquisition reports answer one question: where do downloads come from, and how efficient is each source? This is the half of App Store Connect Analytics a Shopify brand should live in.
Downloads
Your Total Downloads sits in the Overview section. It combines two things worth separating:
- First-Time Downloads: someone installing your app on a device for the first time.
- Redownloads: someone who had it before adding it again (a new phone, a reinstall).
You can break downloads out by territory, device, and source. For a brand app, first-time downloads are your true reach number; redownloads tell you about existing customers coming back to the app after churning off a device.
Sources
The Sources page (under Acquisition) splits your downloads by where they originated: App Store Browse, App Store Search, App Referrers, Web Referrers, and more (Apple's acquisition definitions). This is how you separate installs you earned from installs you drove. For most single-brand Shopify apps, App Store Search on your own brand name plus your own web and app referrers tend to dominate, because you're converting existing customers, not winning strangers in the App Store. If a large share is coming from unattributed browse, treat that as a hypothesis to investigate (is a listing feature, a viral moment, or a mislabelled referrer driving it?) rather than a conclusion.
Conversion rate
Conversion rate is the ratio of downloads and pre-orders to unique impressions: the share of people who saw your app on the App Store and installed it (Apple's acquisition definitions). Apple's example: 100 unique impressions and 50 downloads in a day is a 50% conversion rate.
View it by Source Type to see which sources convert best, or filter to one source for detail. It's tempting to read every conversion-rate move as proof your listing got better or worse, but the rate also shifts when your traffic mix changes: high-intent branded search converts very differently from cold browse, so a change in where impressions come from can move the number on its own. To actually test a new icon or screenshots, Apple's dedicated Product Page Optimization reporting is the stronger basis, because it holds traffic constant and compares treatments directly (Apple's PPO documentation). We wrote a full guide to that work in App Store Optimization for Shopify brands; conversion rate is a directional score, and PPO is how you prove a listing change caused the difference.
App Store features and campaigns
App Store Connect Analytics measures the App Store tools you use to drive and convert installs, and reports each one under acquisition (Apple's acquisition definitions). Four are worth setting up before you need the data:
- Campaign links. Trackable links that send people from your marketing (social, email, paid, cross-promotion) straight to your product page. Make one per creative variant to see which ad, copy, or screenshot drives more installs, then view conversion rate filtered by campaign. This is your app-side equivalent of UTM tracking.
- Custom product pages. Alternate versions of your product page that highlight a specific feature, collection, or use case. Analytics shows how each one converts, so you can point a campaign at the page built for it.
- Product page optimization. A/B tests for your icon, screenshots, and previews. Analytics reports which treatment wins so you can apply it with evidence instead of a guess.
- In-App Events. Timed events (a drop, a sale, a seasonal moment) that surface on the App Store. Analytics shows which ones drove the most engagement.
There's also pre-orders: if you list an app for pre-order before launch, Analytics shows how many you've received, then ties the resulting downloads and sales back to it once you go live.
Each tool changes how people find or view the listing, and Analytics shows the result. Use campaign links, custom product pages, and product page optimization together when you treat the listing like a landing page.
User engagement: active devices, sessions, and retention
Engagement is where you learn whether the app became a habit or a one-time download. Three metrics carry it.
Active devices and sessions tell you how often people open the app. On the Metrics page, you can view or filter sessions by:
- Campaign, to see which acquisition source brings the users who engage most (not just the ones who install).
- Territory, to spot regions with a low ratio of sessions per active device, which can point to weak localization or unclear onboarding.
- Device, to learn where your most engaged users are (usually iPhone for a commerce app), which tells you where to optimize first.
Retention rate measures active devices that installed and opened your app, then came back later, not simply everyone who downloaded. Someone who installs but never opens the app is excluded from the denominator (Apple's retention definition). Apple's example: of the devices that opened your app on May 1, if 20% open it again on May 8, day-7 retention is 20%. Filter it by:
- App Version, to see whether an update improved daily retention.
- Source Type or Campaign, to see whether some acquisition sources produce stickier users than others.
For a Shopify brand, retention is one of the metrics that predicts whether the app becomes a real channel. A low curve can point at onboarding or a thin reason to return, but it isn't always that tidy: product-market fit, how often you refresh the catalog, price, technical quality and crashes, seasonality, and the quality of the traffic you acquired can all pull retention down. Onboarding and reasons to return are the levers you control most directly, and they're the same problem push notifications exist to solve, which we cover in push notifications: the retention channel Shopify brands haven't built yet.
Monetization: the section built for a different business
Here's the caveat that most App Store Connect Analytics guides skip, and the single most useful thing to understand if you sell physical products.
The monetization reports (proceeds, sales, paying users, In-App Purchases, subscriptions) measure transactions that run through Apple's commerce system: paid app downloads, the App Store, or In-App Purchases inside your app (Apple's Sales documentation). That's the system for digital goods and services: subscriptions, game currency, unlocks, digital content. To be clear, Apple does charge commission there, on paid apps and IAP.
Physical goods are different. When a customer buys a swimsuit or a bag of coffee in your app, that sale checks out through Shopify and your own payment processor. Apple's rules require it: physical products consumed outside the app must use a non-IAP payment method, and Apple takes no commission on that physical-goods checkout (App Review Guideline 3.1.3(e)). Which means revenue from your Shopify physical-product orders does not appear in App Store Connect's monetization section. The Sales figure there, the proceeds, the "paying users" count, the new download-to-paid and proceeds-per-download benchmarks: for a physical-goods brand, most of these will read as empty or near-empty, and that's correct behavior, not a bug. (Analytics does still measure any paid-app or IAP sales you run, proceeds, and paying users; for a typical free brand app selling physical goods, that's simply not where the money is.)
So the 2026 monetization update, genuinely useful as it is, is mostly built for subscription and digital-goods apps. If you're a Shopify brand selling physical products, treat the monetization tab as informational and measure revenue where it actually lives:
| You want to know | Where it lives |
|---|---|
| Downloads, sources, conversion rate | App Store Connect Analytics |
| Sessions, retention, crash rate | App Store Connect Analytics |
| App vs web revenue split | Shopify (by sales channel) + your app platform |
| App average order value and repeat rate | Shopify + your app platform |
| Customer lifetime value, app vs web | Shopify + your app platform |
App Store Connect measures the store and the device. Shopify measures revenue. Use both.
Peer group benchmarks: how you compare
Peer group benchmarks put your numbers in context by comparing them to similar apps across the whole App Store catalog, privately. They cover conversion rate, retention rates, crash rate, and average proceeds per paying user, reported weekly (each of these metrics is defined in Apple's metric definitions).
Apple builds your peer group from three attributes:
- App Store category. Only apps in a category you actually belong to, and only when the group is large enough to protect any single app's data.
- Business model. Apps with the same model are grouped together. Apps with In-App Purchases count as freemium or paymium; paid-to-download apps count as paid or paymium; an app only joins the subscription group if auto-renewable subscriptions make up at least 50% of its revenue.
- Download volume. Low, medium, or high volume for a given week.
For a Shopify commerce app, the two useful benchmarks are conversion rate and retention, because they are not tied to Apple's payment system. Treat them like a category median. If conversion is below the peer group, inspect the icon, screenshots, and first two lines of the listing. If retention is below, investigate onboarding and reasons to return. The proceeds benchmarks assume a monetization model you probably do not run.
Benchmarks are built with differential privacy, so you never see another app's individual numbers, only the aggregate. Apple's own apps may be included to round out a category.
Cohorts and filters: the 2026 workhorses
Cohorts are the most practical addition in the update. Apple defines two cohort types: download cohorts and subscription cohorts. You create a cohort by its download date or subscription-start date, then segment it by source, territory, device, and so on, and track that group forward in time (Apple's cohort documentation). Source and territory are how you slice a cohort, not what defines it. That's the right shape for the questions a growing brand actually asks:
- Does the download cohort acquired from a launch campaign retain better than organic installs, four weeks out?
- After expanding to a new market, how long until that region's cohort behaves like your established regions?
- Did a particular week's download cohort stick around after an app update?
Pair cohorts with the new filter depth (up to seven filters on a metric at once) and you can isolate a specific slice without ever exporting to a spreadsheet: one territory, one source, one app version, one device, at the same time. For anything heavier, the Analytics Reports API exports Apple's available granular reports (including the two new subscription reports) into your own data stack, still privacy-aggregated and thresholded rather than raw user-level data (Analytics Reports API).
What App Store Connect Analytics won't tell you, and why it matters
App Store Connect Analytics has real limits a Shopify brand should plan around, none of them flaws exactly, just scope.
- Usage is opt-in and device-based; commerce metrics use Apple's own definitions. Usage and retention metrics only include people who agreed to share diagnostics and usage data, and they count devices, not customers: a customer with an iPhone and an iPad is two devices. Commerce metrics don't all work that way. Apple's "Paying Users," for instance, is based on Apple Accounts, while downloads and App Store views have their own definitions (Apple's metric definitions). The common thread that matters for you: none of these connect to a Shopify customer record. Usage data is fine for trends, imprecise for headcount.
- Privacy thresholds hide small numbers. Sources like app referrers, web referrers, and campaign links need a minimum volume of data before they'll display. A brand-new campaign can look like it's producing nothing when it's simply below the threshold.
- No customer identity, no commerce. App Store Connect can't join a download to a Shopify customer, an order, or an email address. It has no view of average order value, repeat purchase rate, or lifetime value. For a commerce brand, those are the numbers that decide whether the app is working, and they live entirely outside this tool.
This is why brands need two dashboards. App Store Connect Analytics shows whether the app is found, installed, opened, and kept. Commerce analytics show whether it is making money and changing customer behavior. Neither answers the other's question.
How NAPPS fits in
NAPPS is a native mobile app builder for Shopify and Shopify Plus brands. It provides the app that App Store Connect measures and the commerce reporting Apple cannot provide.
Shopify already reports on every sales channel. A NAPPS app is native (SwiftUI on iOS and Jetpack Compose on Android) and connected to the store as a Shopify sales channel, with checkout through Shopify. Its orders, sessions, and revenue appear in Shopify reporting alongside the online store. You can compare app and web AOV, repeat-purchase rate, revenue share, and lifetime value on the same customer records. App Store Connect cannot provide that comparison because it never sees a Shopify order.
That's how NAPPS customers can report numbers App Store Connect will never surface. The app typically converts around 5x to 6x the website, and about 4.7x mobile web (that's a large claim, so read the methodology note below with it): average order value runs +5% to +38% higher in the app, and spend per customer averages roughly +47% higher.
Methodology: based on NAPPS customer data comparing the app channel with the online storefront. Results vary by brand, period, audience mix, and attribution; app audiences are self-selecting, so these comparisons describe observed differences and do not establish causal lift.
Zippy, Portugal's largest children's fashion brand, is the clearest example: within about seven months of launching a NAPPS app, roughly 34% of their total online revenue ran through it, and their app converts about 370% better than mobile web (same methodology and caveats as above). None of that lives in App Store Connect Analytics. All of it lives in Shopify and the app.
Use App Store Connect for acquisition and engagement. Use Shopify and the app channel for revenue.
Frequently asked questions
It's included with App Store Connect at no additional analytics fee, covering iOS, iPadOS, macOS, tvOS, and visionOS apps. Note the Apple Developer Program membership that gives you access is itself paid, so the analytics are bundled rather than free-standing.
No. The monetization reports only measure transactions through Apple's In-App Purchase system, which is for digital goods and subscriptions. Physical products check out through Shopify, so your actual revenue appears in Shopify's sales channel reporting and your app platform, not in App Store Connect.
Because those sales don't run through Apple's commerce system. Apple's rules require physical goods consumed outside the app to be sold with a non-IAP payment method, and Apple takes no commission on that physical-goods checkout, so those Shopify orders never enter the monetization reports. That's expected, not an error. (Any paid-app or in-app-purchase sales you do run will still appear there.)
The reliable, relevant reports are downloads and their sources, conversion rate, active devices and sessions, retention rate, crash rate, and the conversion and retention peer benchmarks. In short: how people find your app, whether they install, and whether they come back.
It's based on active devices that installed and opened your app, then returned in the days after. A device that installs but never opens the app isn't counted, so retention measures repeat opens, not raw downloads. Apple's example: of the devices that opened on May 1, if 20% open again on May 8, day-7 retention is 20%.
Apple offers two cohort types, download cohorts and subscription cohorts. You create a cohort by its download or subscription-start date, then segment it by source, territory, device, and more, and track that group over time, so you can compare how different acquisition periods or segments retain and behave.
The bottom line
App Store Connect Analytics is a useful, no-extra-cost tool for downloads, sources, conversion, sessions, retention, and private peer benchmarks. The 2026 update made its cohorts and filters more useful. Its monetization reports are for subscription and digital-goods apps, so a physical-goods Shopify brand should treat them as informational and measure revenue in Shopify. Use App Store Connect to see how the app is found and used, and Shopify plus the app platform to see what it earns.
If you want an app whose revenue shows up as a real Shopify channel you can measure against your web store, see how NAPPS works ->
Keep reading
October 27, 2026 - 10 min read
4 MobiLoud alternatives for Shopify: pricing and fit


October 23, 2026 - 8 min read
Tapcart vs Shopney: pricing, features, and which fits your Shopify store
September 18, 2026 - 13 min read
Tapcart Alternative: NAPPS Pricing, Features & Migration