

Friday, September 4th 2026
Mobile app metrics for Shopify brands: what to measure beyond installs
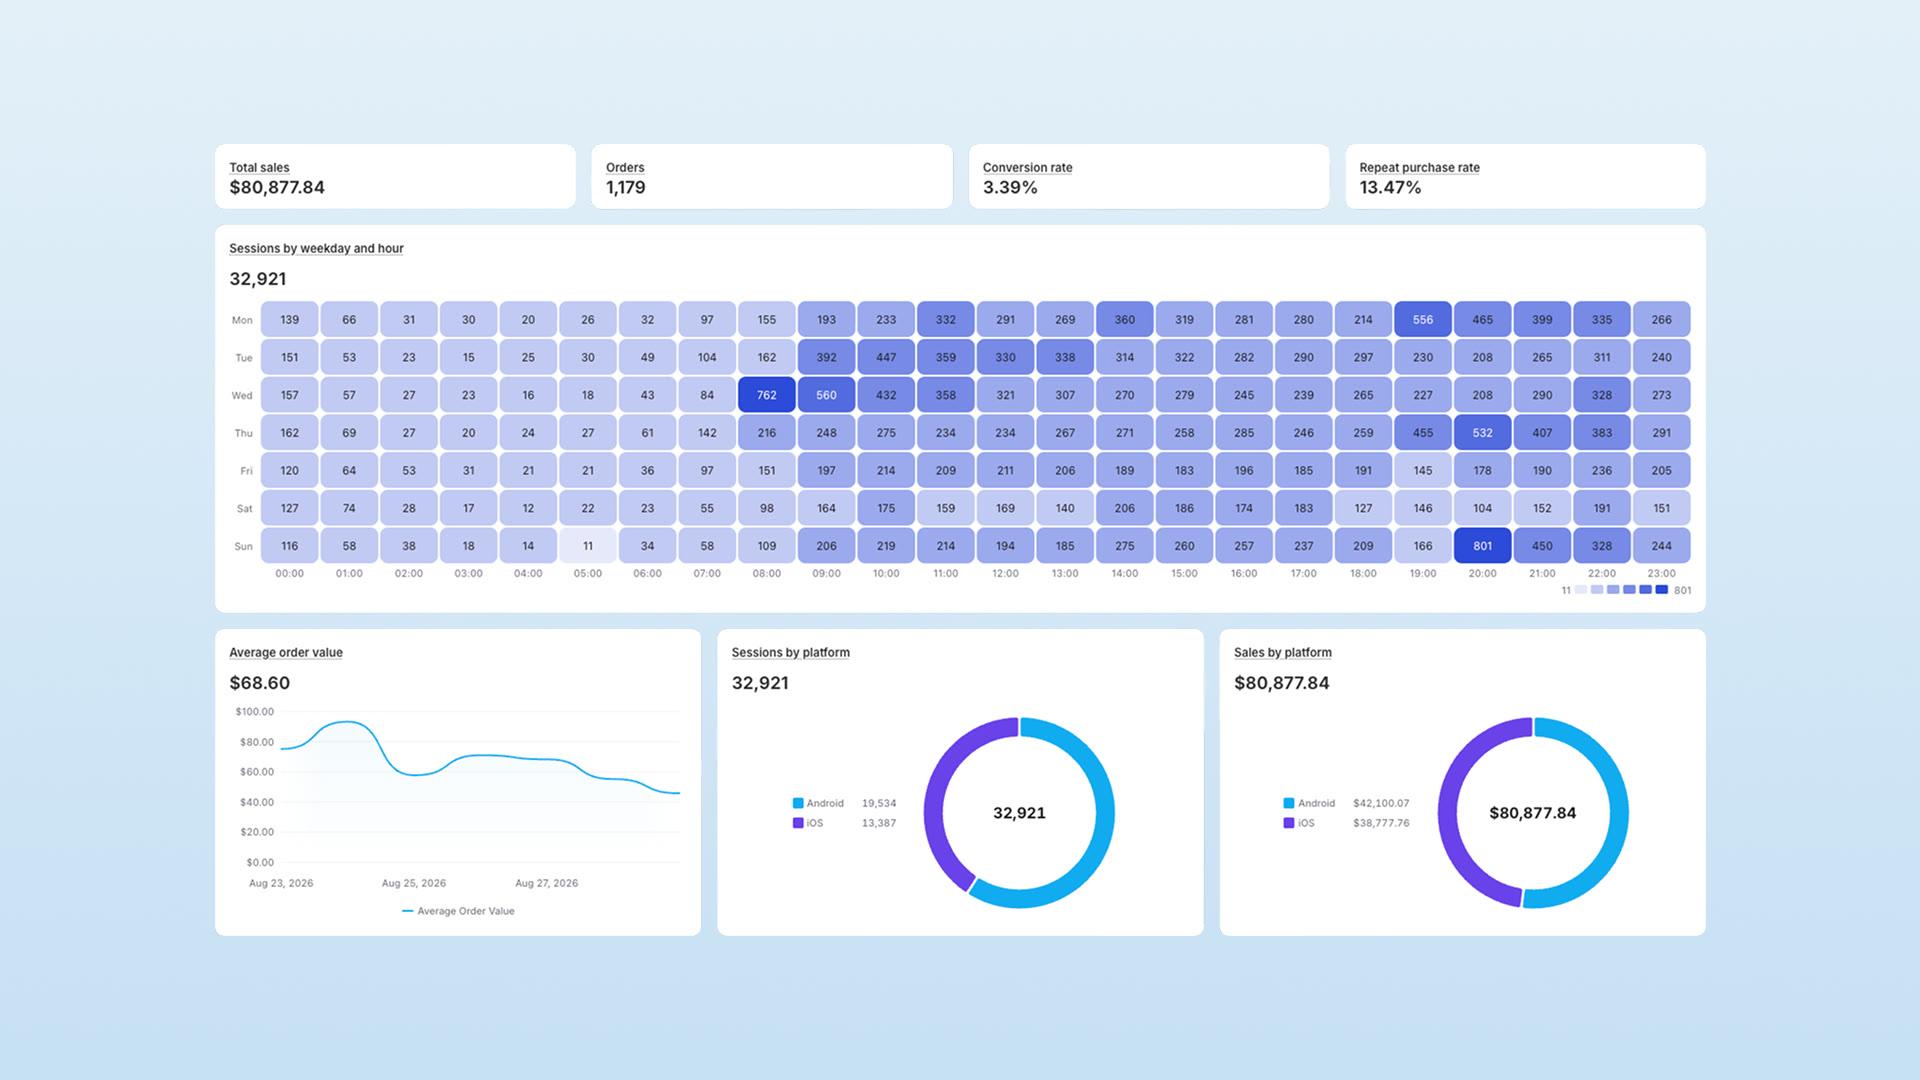

Beyond installs, a Shopify brand should measure whether its mobile app changes customer behavior: the app's share of revenue, activation into a first purchase, repeat purchasing, push contribution, merchandising demand, and experience health. App Store Connect and Google Play Console report acquisition and downloads well, but not your Shopify order data, which is where those answers live.
Installs, sessions, and push opens can look healthy while commercial results remain weak. Use a second dashboard for provider-side and commerce data.
This guide covers the Shopify mobile app metrics that show whether the app earns its place as a sales channel.
It also covers the problem most brands hit before they get to the metrics: the tool. If your app provider gives you no commerce dashboard, you fall back on Google Analytics 4 plus the two store consoles. That combination reports app activity well. It does not report your Shopify order state, and the order state is where the answer lives.
Use this alongside the platform guides: App Store Connect Analytics for Shopify brands covers iOS acquisition and engagement, and Google Play Console Analytics for Shopify brands covers the Android equivalent.
The right measurement model
Do not watch a pile of disconnected KPIs. Use a chain that shows whether customers progress:
Reach -> Install -> First useful session -> Browse
-> Cart -> Purchase -> Repeat purchase -> Long-term value
   (login and notification permission are milestones
    along the way, not required gates before browsing)
A dashboard that only reports installs, sessions, or push opens can look healthy while customers stall before buying. Login and notification permission are not mandatory for every shopper. Many retail apps allow guest browsing and purchase. Treat them as milestones to measure, not gates to force. The dashboard should cover six jobs:
| Job | Question | Core measures |
|---|---|---|
| Commercial value | Is the app becoming a meaningful sales channel? | Revenue share, conversion, AOV, revenue per customer, repeat purchase |
| Activation | Do new installers reach value quickly? | First open, login, push opt-in, product view, cart, first purchase |
| Engagement and retention | Is the app becoming a habit? | Active users, session frequency, D7/D30 retention, uninstall/dormancy |
| Messaging | Does push bring customers back without damaging trust? | Reach, delivery, opens, conversion, revenue, opt-outs |
| Merchandising and demand | Are customers finding and wanting the right products? | Product views, view-to-add rate, wishlist demand, zero-result searches, abandoned products |
| Experience health | Does the app work at the moment intent is highest? | Crash-free sessions, checkout/login success, deep-link success, version adoption |
The rest of this guide takes those six jobs one at a time, then adds a review cadence and a short list of the numbers that fool people. But before any of them, one rule.
Define every metric before you compare it
Many dashboards get metric definitions wrong. "App conversion rate," "revenue per app customer," "repeat purchase rate," "attributed revenue," and "LTV" each have several valid but different calculations. Without definitions, you compare different things and draw the wrong conclusion.
So for every metric on the dashboard, write down eight things:
- Numerator: exactly what you are counting.
- Denominator: exactly what you are dividing by.
- Customer-identity rule: device, account, or resolved customer.
- Attribution window: the time a touch gets credit for an outcome.
- Channel rule: app-only, or all channels a customer uses.
- Timezone: the timezone the number uses, and whether it matches the system you compare against.
- Refund and return treatment: gross, or net of cancellations and returns.
- Owner: the one person accountable for the number and its threshold.
And one hard rule that follows from it: do not compare an app metric with a web metric until their definitions match. The classic failure looks harmless. A team divides app orders by authenticated app users, divides web orders by all Shopify sessions, and announces the app converts 5x better. It doesn't. Those are two different fractions with two different denominators, and the gap is mostly definition, not performance. Fix the denominators first, then compare.
Here is what a defined metric looks like in practice. Four starter rows, in the format every metric on your dashboard should eventually follow:
| Metric | Exact definition | System of record | Owner | Action threshold |
|---|---|---|---|---|
| App conversion rate | App-channel orders (net of cancellations) / app sessions with a product view, same window and timezone | Shopify (orders) + app analytics (sessions) | Ecommerce / growth lead | Investigate if it falls below the rolling 4-week app baseline |
| First-purchase activation rate | New installers who place a first app order within 14 days / all new installers in that cohort, deduped by customer | App analytics + Shopify | Product / growth | Below the prior cohort, or declining across releases |
| 30-day customer repeat rate | App-acquired customers with a 2nd order (any channel) within 30 days / app-acquired customers with a 1st order | Shopify (customer-level) | CRM / retention | Below the prior acquisition cohort |
| Checkout success rate | Completed app orders / app checkout-start events, same window | App analytics + Shopify + payment provider | Engineering + payments | Real-time alert on any material drop |
Notice that every one of those four depends on Shopify data, not on the app alone. That is the point: for a commerce brand, the system of record for money is Shopify, and the app dashboard borrows from it.
If GA4 is your only app dashboard
Google Analytics 4 is an event and audience tool. It is not a system of record for money, and five of its documented behaviors matter before you build a commerce app dashboard on it.
It does not know about a Shopify refund unless you send one. GA4 measures a refund only when your app sends a refund event with the matching transaction_id (GA4 ecommerce measurement). Shopify order state, cancellations, and returns do not flow back on their own. So a net-of-returns number, the one every finance conversation needs, is something you have to build and keep working.
Event-level data expires, and the paid tier only partly fixes it. On a standard property you can keep user-level and event-level data for 2 months or 14 months. Analytics 360 adds 26, 38, and 50 months, but for event-level data only. User-level retention is capped at 14 months on both tiers, and age, gender, and interest data is always held for 2 months whatever you set. There is also a floor you do not control: when a standard property becomes Large, or a 360 property becomes XL, event-level retention drops to 2 months automatically, and data older than 2 months becomes inaccessible and is permanently deleted (GA4 data retention). So a year-over-year cohort read is a 360 feature, and even on 360 it is not guaranteed.
High-cardinality reports collapse into an "(other)" row. When a table passes its row limit, GA4 shows the most common dimension values and condenses the rest into a single "(other)" row. Google's guidance is to treat any dimension with more than 500 values as high-cardinality, and it says plainly that 500 is guidance rather than a limit: the real row limits vary by property type, by report, and with query complexity such as secondary dimensions and filters (GA4 "(other)" row). Product ID and search query are exactly the dimensions a commerce brand needs, and exactly the ones with thousands of values.
Large queries get sampled, which is a separate limit again. Sampling is not the same mechanism as the "(other)" row, and it is worth keeping them apart. Sampling happens when the number of events behind a report, exploration, or request passes your property's quota. That quota is 10 million events on a standard property, and up to 1 billion on Analytics 360, which defaults to 100 million events per query (GA4 data sampling). GA4 then scales the sample up to a directionally accurate figure. That is fine for a traffic trend. It is not fine for reconciling revenue with Shopify, because you cannot tie a scaled estimate back to a specific set of orders.
Some rows are withheld from you. GA4 applies thresholding and hides rows when a report includes demographic or search-query data and the user counts are too low (GA4 data thresholding). Widening the date range can bring them back, which is the opposite of what a daily launch-week review needs.
There is an exit hatch, for brands big enough to use it. GA4 exports raw event data to BigQuery, and you own what lands there. Because you then query your own tables, the "(other)" row, the sampling quotas, and the thresholding stop applying, and the GA4 retention setting stops governing what you already exported. Those are limits on GA4's reporting surfaces, not on the exported data. The daily export is capped at 1 million events per day on a standard property and 20 billion on 360, and a streaming option removes the volume cap for a per-gigabyte fee (GA4 BigQuery export). The catch is that you are now running a warehouse: storage and query costs, SQL, and someone to join GA4 events to Shopify orders and keep those joins right as both sides change. Most Shopify brands should not take that on. If you already have a data team, it is the right way to make GA4 answer commerce questions.
None of this makes GA4 a bad tool. It makes GA4 the wrong single source of truth for revenue. Use it for what it is good at: acquisition, campaign, and audience analysis. Read the commercial layer from Shopify and from an app dashboard built on Shopify's order data, so refunds, discounts, customer type, and repeat behavior arrive already reconciled instead of rebuilt from events.
The same test applies to any tool you are handed. Ask three questions. Does it read Shopify's order state, including refunds and cancellations? Can it report a cohort a year later? Does it define its own metrics, or leave every analyst to define them? A tool that fails all three is a traffic report, not a commerce dashboard.
The minimum viable dashboard
Start with these eight. They cover all five jobs and show whether the app is working before you add a fuller model:
- App revenue share (app revenue / total online revenue)
- App conversion rate (with a defined, web-comparable denominator)
- First-purchase activation rate (new installers to first order)
- 30-day customer repeat rate (second order, any channel)
- D30 retention (do new app users come back)
- Push opt-in and opt-out rate (always read as a pair)
- Checkout success rate (the highest-intent failure point)
- Crash-free sessions (the floor under all of it)
Everything in the six sections below is how you go deeper when one of these eight raises a question. A smaller brand should start here and resist the urge to instrument thirty metrics nobody reviews.
1. Commercial metrics: the executive view
These belong at the top of the dashboard, but read as cohorts, not just daily totals:
- App revenue share: the share of total online revenue that comes through the app.
- App conversion rate: orders divided by a clearly defined app-session or qualified-shopper denominator (see the definition table above; this is the metric most often inflated by a mismatched web comparison).
- Average order value: app AOV compared with the online storefront and mobile web, on matched definitions.
- Revenue per app customer: better than revenue per install, because it does not reward a large, unqualified install base. But it does not solve selection bias: a small group of high-value loyal customers can make it look superb. Always read it alongside the cohort size, the repeat rate, and a matched or holdout comparison when the decision needs a causal claim.
- Two repeat-purchase rates, not one. These answer different questions, and merging them hides the answer to both:
- Customer repeat rate: app-acquired or app-activated customers who buy again through any channel. This tells you whether the app changed customer behavior.
- App-channel repeat rate: customers who buy again specifically through the app. This tells you whether the app is becoming a durable sales channel.
- Merged into one number, the two rates hide each other. Channel switching can make the app look weaker than it is, and an app-only view can hide that customers happily repurchase elsewhere. Track both.
- 30-, 60-, and 90-day cohort revenue or LTV: what customers acquired or activated in a period actually spend later. Define the scope explicitly: does "value" include all subsequent Shopify purchases across channels, or only app-attributed orders? The two answer different questions, and the number is meaningless until you say which one you mean.
- Marketing and SMS opt-in rate at checkout: the share of app checkouts where the customer accepted email or SMS marketing. The app grows the lists your whole retention program runs on, and that is commercial value even in a period when order value is flat.
- Discount share of sales, and performance by discount code: discounted value divided by gross sales, plus what each code cost you and how many orders it touched. An app channel that grows on discount codes is a different business case from one that grows at full price, and this is the fastest way to see which one you have. It is also the first input to the margin question below.
- Order contribution margin, where available: revenue after discount, product cost, shipping subsidy, payment fees, and returns. Call it order contribution margin, not "app contribution profit," because a true app-channel profit figure also has to carry app-platform fees, build and maintenance, paid acquisition, CRM and push tooling, promotional discount cost, and support. Name whichever costs you have actually included so nobody reads a margin as a fully loaded profit.
One caveat is important enough to state before anyone celebrates an app AOV or LTV advantage: an app audience is often self-selecting. Its customers may already be more loyal and higher-intent than mobile-web visitors, so an app advantage is a genuine business observation, not proof that the app alone caused it. When a decision needs causal proof, use matched cohorts, holdouts, or controlled rollouts. That same incrementality discipline is what separates a defensible app business case from a wishful one, which we cover in the Shopify mobile app ROI guide.
Shopify itself identifies repeat-purchase sales, customer retention, and lifetime value as core customer-loyalty measures, and they belong in this layer even when your app provider helps surface them (Shopify on repeat-customer metrics).
When to review: weekly for directional movement, monthly for cohort revenue and contribution, quarterly for the strategic question of whether the app is earning its investment.
2. Activation metrics: where most app value is won or lost
An install is a possibility, not an outcome. The first job is to find the earliest behavior that predicts a valuable customer. For a typical retail app, the core activation path runs through shopping intent, with login and push permission sitting beside it as optional milestones rather than mandatory steps:
First open -> market selected -> product viewed -> add to cart
-> checkout started -> first order
   optional milestones (measure, do not force):
   logged in, notification permission granted
A guest can view products, add to cart, and often buy without ever logging in, and forcing login or a permission prompt before value is shown usually costs you more customers than it captures. So measure login and push opt-in as milestones and study where they help, but do not model them as gates every customer must pass. Track each stage's completion rate and time to completion, and segment the funnel by platform, app version, campaign, country, new versus returning customer, and entry path. The highest-priority activation measures are:
- Install-to-first-open rate
- First-open-to-login rate
- Push opt-in rate
- First-session product-view rate
- Add-to-cart rate
- Checkout-start rate
- Install- or first-open-to-first-purchase rate
- Median time to first purchase
Two abandonment numbers are easy to confuse, and they do not describe the same drop-off. Cart abandonment is the share of sessions that added something to the cart and never reached checkout. Checkout abandonment is the share of started checkouts that were never completed. The first covers a stage the second cannot see, so a brand watching only checkout abandonment is blind to the larger leak. Report both, and label which one you mean.
Do not optimize every early event equally. Pick one or two that are both frequent enough to diagnose and genuinely predictive of first purchase. For some brands that is login; for others it is viewing a product or adding to cart. The point is to choose your activation moment deliberately rather than chasing every tap.
For this to work, your events need a consistent commerce taxonomy. Firebase's ecommerce reference, for example, defines standard events such as view_item, add_to_cart, begin_checkout, and purchase, and standardizing on a schema like that keeps the funnel comparable across platforms and releases (Firebase ecommerce event reference).
When to review: daily during launch week and after a major release, twice weekly during the first month, weekly once the activation flow is stable. The first 90 days guide walks through what to expect from this funnel early on.
3. Engagement and retention: measure a return loop, not screen time
For ecommerce, more screen time is not automatically good. Someone who needs six sessions to finish a simple checkout is frustrated, not engaged. So measure the return loop instead:
- Weekly and monthly active users
- Sessions per active user
- Days active per customer
- D1, D7, D30 retention: whether app users come back after first use
- Reactivation rate: dormant users who return after an app, product, or CRM trigger
- Repeat purchase rate and time between orders
- New versus returning sessions and customers, read as a pair so you can see whether growth is new arrivals or a returning habit
- Uninstalls, user loss, or dormant installed audience
- Dormant reachable audience: devices last seen more than 30, 60, or 90 days ago that still allow notifications. Uninstalls live in the store consoles, but a dormant install you can still reach is a segment you can act on this week
The real gains are in cohorts. Compare customers by first-open week, first-purchase week, acquisition source, app version, country, loyalty status, and push-permission status. That reveals whether a new version, a launch incentive, or a notification program produced a genuinely healthier group of customers, rather than a short-lived aggregate spike. Building that return loop deliberately is the whole subject of the app growth guide.
There is good reason to take the first session seriously. In Amplitude's 2025 benchmark research, 69% of the companies in its top group for week-one activation were also top performers for three-month retention. That is a vendor benchmark association, not proof of causation, and the report frames it that way, but it is a solid reason to measure activation as if it were a retention metric (Amplitude ecommerce benchmark summary).
When to review: weekly for active users, session frequency, and reactivation, monthly for D30 retention, quarterly for repeat-purchase and LTV cohorts.
4. Push metrics: measure both revenue and customer permission
Push deserves its own scorecard, because it can be one of the app's strongest retention capabilities and one of the fastest ways to create fatigue. Track the whole chain:
Eligible app audience -> opted-in audience -> sent -> delivered
-> opened -> app session -> product/cart action -> purchase
The core metrics:
- Push opt-in rate: reachable endpoints divided by eligible ones
- Reachable audience: opted-in, active devices, not all historical installs. Note this is usually device-level, not person-level: one customer with an iPhone and an iPad is one customer but two reachable push endpoints, so do not read "reachable audience" as a headcount.
- Delivery rate: delivered divided by sent. Treat this as provider- and platform-specific, not an exact receipt. What "delivered" means and how reliably it is reported differs between iOS (APNs) and Android (FCM), so do not compare delivery rates across platforms as if they measured the same thing.
- Direct open rate: taps divided by delivered notifications
- Influenced session rate: app sessions after a send, compared with baseline behavior. This is a directional attribution measure, not a causal one. A lift over baseline is suggestive, but to claim the push caused the sessions you need a holdout or a credible counterfactual, because people who opted in and are active would have opened the app anyway at some rate.
- Push conversion rate: recipients who complete the intended action
- Attributed revenue: using a pre-defined attribution window
- Opt-out rate, uninstall rate, and campaign frequency: the health guardrails
- Every one of the above, split by content type. Order and shipping notifications behave nothing like marketing sends: different audiences, different expectations, different delivery and open rates. Blend them into one number and you get an open rate that describes neither. Split them before you set a single threshold.
The rule that keeps push honest: always pair a positive signal with a negative one. A campaign can lift opens and orders while it also lifts opt-outs, and that is not a clean success.
One more attribution rule matters across the whole stack: never sum attributed revenue across push, email, SMS, paid media, and app attribution. The same order can be claimed by several channels at once, so adding their attributed revenue together double-counts and can easily exceed your actual revenue. Pick one attribution model, or report each channel's claim separately and clearly labeled.
Braze's guidance lands on a similar scorecard, naming opt-in, delivery, open and click, conversion, revenue, and opt-out as the essential push measures (Braze's push-metrics guide). That is a useful checklist, though as a platform vendor's guide it is a definition reference, not independent evidence. For the strategy behind these numbers, see the push notifications retention guide. If Klaviyo is your lifecycle platform, the Klaviyo push notifications guide covers which app events to send and how to keep Klaviyo's message attribution separate from Shopify's order ledger.
When to review: immediately after significant sends, weekly by campaign type and segment, monthly for opt-in, opt-out, and the long-term effect on retained users.
5. Merchandising and demand: what the app tells you about the catalog
An app session is a stream of intent signals, and most brands never read them. These measures turn app behavior into merchandising decisions:
- Product views, add-to-cart, and view-to-add rate, per product. A product with many views and a low view-to-add rate has a price, image, description, or stock problem, not a traffic problem.
- Wishlist demand. Wishlist adds per product, and the wishlist rate against views. This is stated intent with no purchase attached, which makes it a restock list and a campaign list.
- Reach per product. Distinct sessions and distinct customers who saw a product, not just the view count. It separates one obsessive shopper from broad interest.
- Zero-result search rate, and the queries behind it. The share of searches that return nothing, grouped by query. Read as a list, those queries are demand your catalog, your product naming, or your search synonyms do not serve. Some are products to stock. Many are products you already sell under a name customers do not use.
- Searches per session. Rising searches per session on a stable catalog usually means navigation is failing, not that customers got more engaged.
- Most abandoned products and variants. Cart value and quantity left behind, by product and by variant. One variant dominating the list is usually a stock, sizing, or shipping-cost problem rather than a demand problem.
- Average add-to-cart price against average order value. When the two drift apart, either your cross-sell or your discounting changed. Find out which.
- Drop and app-exclusive launch performance. For each drop or shoppable placement: impressions, click-through rate, product views, adds to cart, wishlist adds, unique sessions engaged, and the attributed sales and units behind it. Read it per drop and per format. It answers whether an app-exclusive launch created demand or only moved demand that was arriving anyway, which is the same incrementality question as everywhere else in this guide. One caution: a session that engaged two drops credits both, so drop revenue will not sum to total revenue.
This layer is where an app dashboard pays for itself fastest, because every item on that list turns into a decision someone can make this week: restock, rename, reprice, reshoot, or add a synonym.
When to review: weekly for zero-result searches and abandoned products, monthly for view-to-add rate and wishlist demand by category, and before every campaign or product drop.
6. Experience health: the metrics that protect conversion
An app can have excellent merchandising and messaging and still fail exactly where customer intent is highest: login, payment, product load, or deep-link arrival. These are the signals to alert on, but a warning first: no single party owns all of them. Login, checkout, payment, catalog, identity, and push delivery span the app, Shopify, your payment providers, your ESP, and your monitoring tools. So for each one, decide which system is the source of truth and who gets paged, or the alert fires into a vacuum:
| Signal | Typical source of truth | Typical owner |
|---|---|---|
| Crash-free sessions and users, ANRs and freezes | App / crash-reporting tool | App engineering |
| App-start and key-screen load time | App / performance monitoring | App engineering |
| Login success and failure rate | App + identity / auth provider | App + platform |
| Checkout-start-to-order success | App + Shopify checkout | Ecommerce + engineering |
| Checkouts per cart (restarted checkouts) | App + Shopify checkout | Ecommerce + engineering |
| Checkout abandonment by payment gateway | App + Shopify + payment provider | Payments |
| Payment failures, where observable | Payment provider + Shopify | Payments |
| Product and catalog sync failures | App + Shopify catalog | Engineering |
| Deep-link and push tap-to-destination success | App + ESP / push provider | App + CRM |
| Version adoption (share on the latest version) | App dashboard + store consoles | App engineering |
One signal deserves naming, because it is cheap to watch and almost nobody watches it: checkouts per cart. Divide the checkouts started by the distinct carts behind them. Above 1 means customers are restarting checkout on the same cart, and that usually points at a payment or shipping step that is failing, not at a shopper who changed their mind. Split checkout abandonment by payment gateway alongside it, and a broken gateway shows up within a day instead of inside a monthly revenue miss.
These are not just technical metrics. A deep link that opens the home screen instead of the promised product, a login loop after a push, or an Android freeze during checkout is a direct leak in the revenue funnel. Android defines an ANR as an app failing to respond to an input event in time, and user-visible input-dispatch ANRs are especially damaging because they happen while the customer is actively trying to interact (Android ANR guidance).
When to review: continuous alerts for severe failures, daily after a release, weekly trend review, monthly version and device analysis.
7. App-store analytics: the part only Apple and Google can tell you
Keep the Apple and Google numbers on the dashboard, and place them below the commerce data. Read this section as the list of numbers no app provider can hand you, because neither store publishes an API for most of it. You already have the access as the developer account holder, so use it:
- Store impressions and listing visitors
- Product-page and listing conversion
- First-time downloads and re-downloads
- Install-to-first-open
- Uninstalls, user loss, and installed audience
- Pre-install acquisition source and campaign performance
- Store reviews and ratings
- App-store crash, vitals, and retention signals
- Store-listing experiments and custom listing performance
One of those needs a qualifier. The consoles own the source of the install. Your app owns the source of the session after that install, through campaign parameters and referrers, so treat pre-install and post-install source as two separate measures instead of one number.
Apple's App Analytics usage metrics include sessions, active devices, crashes, and deletions, but are based on users who opted in to share data (Apple metric definitions). Google Play Console offers acquisition, installed-audience, user-loss, conversion, quality, and peer-comparison views (Google Play statistics documentation).
These are valuable for diagnosing discovery, store conversion, and technical health. They should not be treated as the source of truth for Shopify physical-goods revenue, AOV, repeat purchase, or LTV. That data never enters the store consoles, because physical-goods orders check out through Shopify, not Apple or Google billing.
Recommended review cadence
Metrics without a rhythm turn into a wall of numbers nobody acts on. This is a workable default:
| Moment | What the team watches | Why |
|---|---|---|
| Before launch | Event mapping, Shopify reconciliation, baseline storefront metrics, release and alert plan | Prevents launching with no trustworthy measurement |
| Launch week | Daily installs, first opens, activation funnel, push opt-in, login/checkout failures, crashes, reviews | Small problems compound fastest when attention is highest |
| First 30 days | Twice-weekly funnel and campaign review, weekly cohort read | Find the first-purchase and notification bottlenecks |
| Steady state | Weekly app-growth, merchandising, and CRM review | Adjust campaigns, merchandising, pushes, and segments |
| Month-end | Revenue share, conversion, AOV, retention, repeat purchase, cohort revenue | Separates real growth from a temporary campaign spike |
| Quarterly | LTV, contribution, incrementality, roadmap priorities, platform quality | Decides whether the app is growing the business, not just activity |
| Any time | Alerts for checkout, login, catalog, deep-link, payment, crash, or push-delivery regressions | These are immediate customer-experience incidents |
The pre-launch and launch-week rows are worth their own preparation; the launch checklist covers the event mapping and reconciliation that make the rest of this table trustworthy.
Do not be fooled
Do not accept a flattering number at face value:
- Installs are not customers.
- Sessions are not satisfaction.
- Push opens are not revenue.
- Attributed revenue is not necessarily incremental revenue.
- App AOV is not proof of app-caused lift.
- A store console does not know your Shopify physical-product revenue.
- An event tool is not a system of record for money.
- A zero-result search is a lost sale no conversion rate will show you.
- A total-app dashboard can hide a bad release, country, device, segment, or acquisition source.
- A metric with no owner, threshold, or next action is decoration.
That last one is the discipline behind all the others. The strongest version of an app dashboard is not "the 25 metrics to track." It is: which metric answers which question, who owns it, and when the team should act. Everything else is activity, not outcome.
How NAPPS fits in
NAPPS is a native mobile app builder for Shopify and Shopify Plus brands, and our job in this model is the app provider's job: build the app the store consoles measure at the top of the funnel, and supply the commerce-side view they can't.
The reason NAPPS can supply that view is how the app is implemented. A NAPPS app is truly native (SwiftUI on iOS, Jetpack Compose on Android) and it is wired into your store as a Shopify sales channel, with checkout running through Shopify. So the app's orders and revenue land in Shopify's own reporting next to your online store, and the commercial metrics in section 1, revenue share, conversion, AOV, and repeat purchase, are ordinary Shopify sales-channel comparisons rather than something you have to reconstruct. (How cleanly each metric resolves to a single customer depends on your login, identity resolution, and reporting setup.)
NAPPS includes an analytics dashboard built on that order data, organized close to the six jobs in this guide:
| Dashboard area | The question it answers | Examples of what it reports |
|---|---|---|
| Overview | Is the channel working this week? | Total sales, orders, conversion rate, repeat purchase rate, average order value, sessions and sales split by iOS and Android, sessions by weekday and hour |
| Sales and customers | Is it building customer value? | Lifetime value, average orders per customer, average time between orders, average items per cart, new versus recurring sales, customer-type economics, top markets, lifetime value by market |
| Acquisition and checkout | Where do customers stall? | The app funnel from sessions to cart additions to cart views to completed checkouts, traffic, session duration, new versus recurring sessions, conversion by market, most abandoned products and variants |
| Products | What is the catalog doing? | Best sellers by revenue, view-to-add conversion, wishlist demand, reach per product, average add-to-cart price |
| Campaigns | Do push and drops earn their place? | Notifications sent, delivery receipts, click rate, and the sessions, add-to-carts, checkouts, orders, and sales from recipients in the 12 hours after a send, including revenue per recipient, all split by content type. Plus drop performance by format: impressions, click-through rate, products added, wishlist adds, attributed sales, units, and orders |
Two things about that list matter more than the list itself.
The push numbers carry a stated attribution window: recipients, within 12 hours of the send. That is deliberately narrower than the credit an email platform or an ad network will claim for the same order. A narrow, named window is a number you can put in a report without inflating it, and it keeps you honest about the rule from section 4: do not sum attributed revenue across channels.
The definitions ship with the metrics. Checkout completion (Shopify's completed flag) and checkout-to-order (whether the session went on to place an order) are reported as two separate measures, because they answer two different questions. Cart abandonment and checkout abandonment are separated the same way. Push reach is device-level, and it says so, because one customer with a phone and a tablet is one customer and two reachable endpoints. That is the eight-point definition exercise from earlier in this guide, done once and centrally, instead of once per analyst.
And the honest part. Three things in this guide are not ours to report, and you should be suspicious of any provider who claims otherwise:
- Installs, install-to-first-open, and uninstalls live in App Store Connect and Google Play Console. Neither store offers an API for them, so you read them there, in accounts you already own.
- Install-based retention curves, the D1, D7, and D30 kind, are a store-console and product-analytics measure. Our cohorts are built on orders and customers, which answers the commercial question well and is not the same number.
- Crash-free sessions, ANRs, and screen load time belong to your crash and performance tooling, and to the vitals reporting in the consoles.
So the working setup is three surfaces, not one: the store consoles above the install, the app dashboard and Shopify below it, and a crash tool underneath all of it.
That is how NAPPS customers can report numbers the store consoles will never surface. The app typically converts at around 5x to 6x the website rate, and about 4.7x mobile web (a large claim, so read the methodology note with it). Average order value runs +5% to +38% higher in the app, and spend per customer averages roughly +47% higher.
Methodology: based on NAPPS customer data comparing the app channel with the online storefront. Results vary by brand, period, audience mix, and attribution; app audiences are self-selecting, so these comparisons describe observed differences and do not establish causal lift. This is the same self-selection caveat flagged in the commercial-metrics section above.
Zippy, Portugal's largest children's fashion brand, is the clearest example: across the first seven months after launch, an average of roughly 34% of their total online revenue ran through the app, and their app converts about 370% better than mobile web (same methodology and caveats). Their push channel averages a 21% open rate on segmented campaigns sent to an opted-in audience, not on daily promotional blasts, which is the kind of engaged-audience result section 4 is built to measure.
Use the store consoles for discovery and store conversion. Use Shopify and your app channel for the commercial, activation, retention, merchandising, and experience-health metrics that decide whether the app is working.
Frequently asked questions
The store consoles answer whether customers can find and install the app: impressions, listing conversion, downloads, and sources. A commerce-side dashboard answers whether the app is changing customer behavior and growing the business: revenue share, conversion, AOV, repeat purchase, retention, merchandising demand, and experience health. You need both, but for a commerce brand the second one decides whether the app was worth building.
There is no universal single metric. The most meaningful outcome, where your measurement maturity allows it, is cohort contribution profit or incremental contribution, because that is the number that reflects whether the app is actually adding value net of its costs. Support it with the customer repeat rate and retention, which are easier to measure and read as cohorts. Revenue per app customer and raw repeat purchase rate resist the install-count vanity trap, but on their own they can flatter a self-selected, high-value audience, so treat them as supporting evidence rather than the verdict.
Because both can rise while the commercial result stalls. Installs are not customers, and sessions are not satisfaction: a customer who needs six sessions to finish a checkout is frustrated, not engaged. Measure the chain from install through first purchase to repeat purchase, not the top of it alone.
You often can't from the raw comparison, because app audiences are self-selecting and tend to be more loyal to begin with. A higher app AOV is a useful business observation, but to claim the app caused the lift you need matched cohorts, holdouts, or a controlled rollout.
Not the commercial layer. GA4 is an event and audience tool, and it only records a refund if your app sends a refund event with the matching transaction ID, so a net-of-returns figure is something you build and maintain yourself. A standard GA4 property keeps event-level data for 2 or 14 months. Analytics 360 adds 26, 38, and 50 months for event-level data, but both tiers cap user-level data at 14 months, and a property that grows into the Large or XL band drops to 2 months automatically. Large queries are also sampled once they pass 10 million events on a standard property, or up to 1 billion on 360, and high-cardinality reports such as product ID and search query condense into an "(other)" row at the row limit. Use GA4 for acquisition, campaigns, and audiences. Read revenue, refunds, customer type, and repeat purchase from Shopify and from an app dashboard built on Shopify's order data.
Everything upstream of the install, plus the stores' own quality reporting: impressions and listing visitors, listing conversion, first-time downloads, install-to-first-open, uninstalls and user loss, ratings and written reviews, store-listing experiments, and crash and vitals data including Android ANRs. Neither store publishes an API for most of it, so no app provider can put those numbers in your dashboard. You already have the access as the account holder. Everything downstream of the first open, from session to order to repeat order, belongs to your app dashboard and to Shopify.
Match the cadence to the decision: daily during launch week and after major releases, weekly for growth and push, monthly for revenue share and retention cohorts, and quarterly for LTV, contribution, and incrementality. Severe checkout, login, payment, or crash regressions should alert in real time, not wait for a review.
The bottom line
The app stores tell you whether people can find and install your app. They cannot tell you whether the app is making the business stronger, because they never see a Shopify order. That is the job of a second, commerce-side dashboard built around six questions: is the app a meaningful sales channel, do new installers reach value quickly, is it becoming a habit, does push bring customers back without burning trust, is the catalog serving the demand customers show, and does the app work when intent is highest. An event tool such as GA4 can help with acquisition and audiences, but it does not hold your Shopify order state, so it cannot answer the first question on that list. Track the chain from reach to long-term value, give every metric an owner and a threshold, and read the flattering numbers with suspicion. An app provider should help you run a better commerce channel, not report a bigger download count.
If you want an app whose revenue shows up as a real Shopify channel you can measure the way this guide describes, we can walk you through how NAPPS does it.
See these metrics for your own store
A NAPPS app runs as a Shopify sales channel, so its revenue share, conversion, cohorts, push performance, and merchandising signals arrive already reconciled with your order data.
Book a 20-minute callKeep reading
October 27, 2026 - 10 min read
4 MobiLoud alternatives for Shopify: pricing and fit


October 23, 2026 - 8 min read
Tapcart vs Shopney: pricing, features, and which fits your Shopify store
September 18, 2026 - 13 min read
Tapcart Alternative: NAPPS Pricing, Features & Migration